news article
The importance of church statistics
January 19, 2024 / By Autumn Wells, Administrative and Accounting Services Specialist / .(JavaScript must be enabled to view this email address)
There are many reasons why church statistics are so important and why they need to be up-to-date. First and foremost, they are there to help your church mission. Statistics allow a church to see trends such as growth or decline in membership, revenue, expenses, attendance, membership makeup, amount of youth, and more. These trends can help a church plan for the future. There are many distinct groups who view and analyze this data, nationally and regionally. The data reports different information than your financial audits in the fall, which just go to your District and Annual Conference. The ACStats information goes across all missions, ministries, and agencies both nationally and globally. This is how we quantify our vision that WE ARE UNITED.
The big picture: General Conference
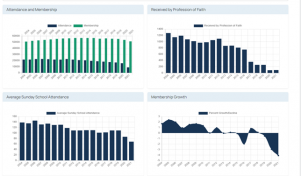 A year-by-year analysis shows growth or decline in any certain area. This data is invaluable to The United Methodist Church. The United Methodist data is compiled here.
The General Council’s multiple boards and departments analyze this data for many reasons. If you are interested in which board uses each question, click here to take a look at the “Understanding Data Terms” webpage for more details.
The Book of Discipline mandates the collection of statistics, for vital reasons. Collection of up-to-date statistics are used in the following ways:
- Episcopal formula for determining the number of bishops;
- Correct apportionment calculations;
- General Conference delegate counts; and
- Providing a complete data set for denominational leadership to understand trends to inform and aid ministry growth.
As you can see, using old statistics could result in over- and under-calculating any number of areas, which have impacts and repercussions on the whole denomination. More importantly, our covenant to be methodical by adhering to The Book of Discipline is broken.
The United Methodist Publishing House (UMPH) uses the statistics to assist in planning resources and marketing. The General Board of Global Ministries (GBGM) uses them to help annual conferences plan how to more effectively minister within their own communities. The General Commission on the Status and Role of Women (COSROW) and the General Commission on Religion and Race (GCORR) use the information to assist in monitoring and raising consciousness of gender and racial/ethnic inclusiveness in The United Methodist Church.
GCFA apportionments
The apportionments that United Methodists of Upper New York pay to General Conference are based on your local church statistical reports. These apportionments fund the work of the General Church like global missions, agencies, and boards. These boards use your analytics to determine their budgets. Some examples of these are United Methodist Committee on Relief (UMCOR), Special Sundays, World Service Fund, Black College Fund, and Africa University Fund. This is how we quantify being UNITED AROUND THE WORLD.
Click here to read more.
Zooming in on the Upper New York Conference
How can we serve if we don’t know? The Upper New York Annual Conference uses statistical data to help you in a wide variety of ways. The data shows trends that maybe we or even you didn’t notice. When we look at the trends over time, there are some interventions we will take that will assist you. Here are just a few uses of the statistical data:
 New opportunities
They help local churches analyze where there are new opportunities for outreach. District Superintendents (DSs), the Director of Missional Excellence, and the Director of New Faith Communities use this to find ways to reach more people. They analyze trends to pull the right people and resources together to develop new methods of spreading the good news and outreach. This is how we quantify SHARING GOD’S HOPE.
Appointment
The District Superintendents use key factors like attendance and membership to assist in the clergy appointment process. The balance needs to be right for your congregation. This is how we quantify MAKING DISCIPLES OF JESUS CHRIST.
Ministry Impact
 The leadership of the Annual Conference uses the reports to help identify local churches that are having extraordinary impact in a certain area of ministry. Doing something great? Your figures will show it. This lets everyone else know too so others might find where there are new opportunities for outreach. Your District Superintendent will assist you in maximizing the missional impact for your church and those around you. This is how we quantify being UNITED IN LOVE.
Committees
In addition to the Conference Advance Specials, below are just a small select committees that use your stats reports:
 GCORR and COSROW use the data collected. Equality and diversity are important to us all, on a local level and nationally. The committee uses this data and compares it to demographics in the local area using platforms like MissionInsite. If the church data shows trends that aren’t reflected in the neighboring areas, the committee and/or the District Superintendent will make intentional modifications to promote a better representation of the population. This is how quantify if we are being GOD’S LOVE WITH OUR NEIGHBORS.
 - Volunteers in Mission Committee and Conference staff analyze the stats data reported on lines 20a and 20b to see which local churches have VIM teams and how many members. This can be useful for when a disaster strikes, we have numbers in hand to deploy needed help immediately. This is also helpful in planning development in newer areas where there are scarce VIM teams. This is how we quantify being UNITED IN SERVICE.
To learn more about United Methodist Volunteers in Mission, click here.
Annual Conference apportionments
Apportionments from the Conference are based on all local churches total operating income that is represented by line 52. Line 52 is a total of giving, fundraisers, and other income from church assets.
Workers Compensation and Medicare compliance
The Conference uses the stats for reporting Worker’s Compensation, Disability, and Paid Family Leave data to New York State with the number of employees and gender. If there are any questions by the state regarding our reporting, the statistics report is also referenced. The report also helps with the Medicare MSPSEE certification to make sure that the MSPSEE is allowed. This is how we quantify being UNITED IN SEEKING JUSTICE.
For the local churches
For many local pastors, annual statistics reporting is the only place they compile this data. For many, if you don't complete them, you would have no record of worship attendance, discipleship, fiscal changes. Churches use the stats to demonstrate growth or decline, year to year, to a church council. This is your first notification that something is going on so you can be on the move in the right direction for change that you want to see happen.
Local forecasting
The reports help with forecasting and financial analysis. The various applications in our Conference ask for you to use your past data to help you understand where you stand whether in mission, membership, or finances. They are invaluable to help create budgets and forecast projections to keep the church moving forward.
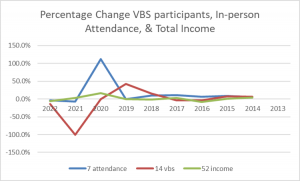 Try running reports and graphs of the last ten years comparing your capital building improvements or your local food pantry program expenses. Or try comparing Vacation Bible School participants to income? What does it show you? Is one budget area staying stagnant?
Ministry areas for outreach
It will bring it to your attention that a trend is occurring. For instance, if line 12 confirmation numbers are down year-over-year, this is an indication that you need to create initiatives for more youth. While your DS can help, you know your community better than anyone and will be the first to make this turnaround happen. This is how we quantify being UNITED IN OUR COMMUNITIES.
 As you can see there are many reasons why our statistics are so important to showcase our people and ministries. The trends help from globally to nationally to your neighborhood. Reporting that is measured differently from your other charge conference forms. We encourage you to continue your ministries with tools of knowledge and collaboration. Some of these tools are set forth by completing the annual statistics completely and accurately. We are United Methodists of Upper New York.